
Test MHA-1640
March 31, 2016
Go to all tests
Repeat of 1627, all birch.
Extra test #5 of matched load series to investigate PM repeatability with cordwood
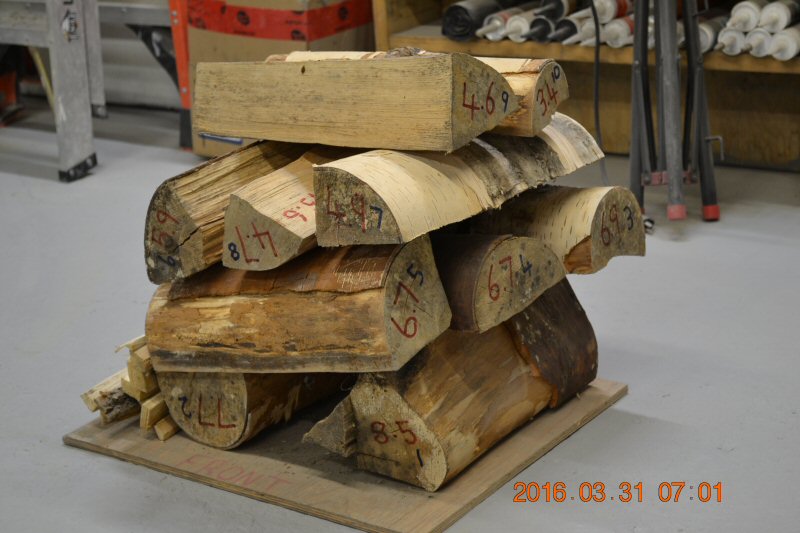
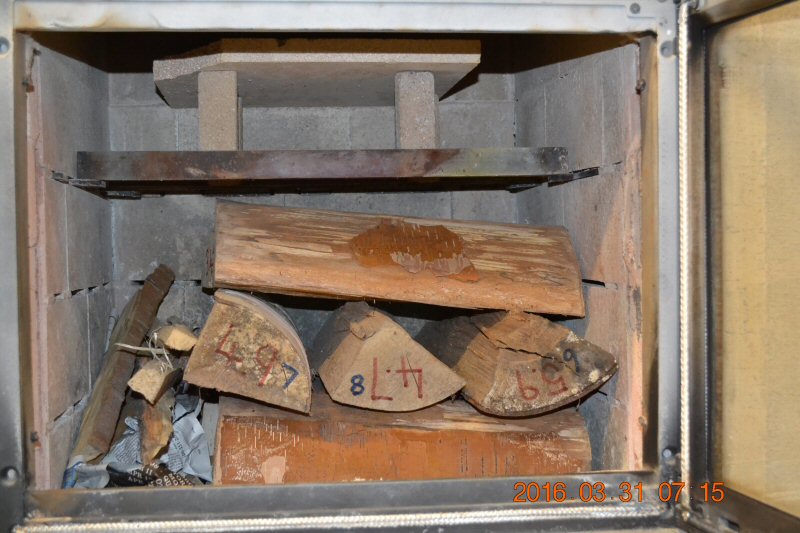
Log cabin stacking, side ignition,
63.0 lbs including 3.0 lbs kindling
16.2% moisture.
Last test of this series.
"Heavy air" day, rainy and foggy.
Intake air flow down about 5%. Compare lab notes (link below) with MHA-1628,
also a "heavy air" day, also down 5%.
Baffle supports opened up. See MHA-1625
Air slots in firebox unblocked, except for top course (25% restriction)
See MHA-1623 for other modifications.
Original test + 6 matched loads + 5 extra tests
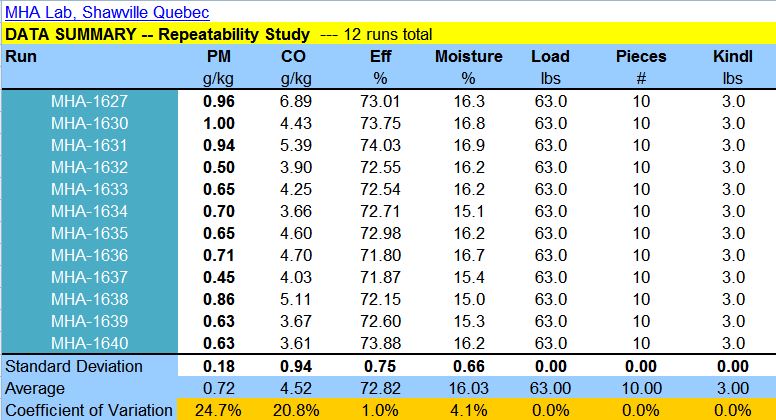
Coefficient of Variation (CV, or COV) is the standard deviation divided by the average.
25% COV means that on average a PM test number is accurate within +/- 25%
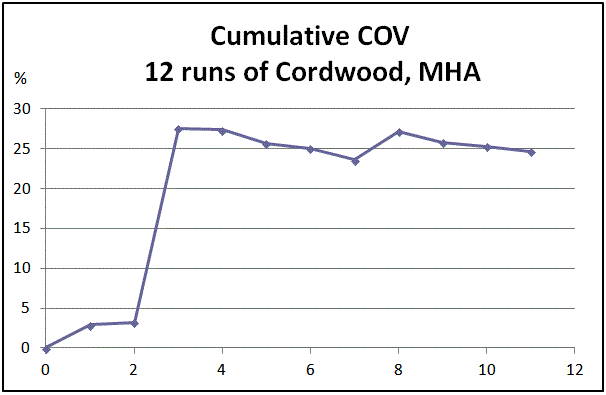
Cumulative coefficient of variation. After the first 3 tests, it looked like the COV was very tight, around 3%.
However, with more tests it settled to its realistic value, around 25%.
Compare with previous Lopez Labs crib repeatability testing, which yielded a COV of 10.2% with 4 sets of matched cribs (8 test runs)
Note
in the crib testing that the CO repeatability was much tigher, within
1.5%, although the CO value itself was about 8X higher than the
Eco-firebox.
In both cases, the efficiency was extremely tight.
Recently, MHA ran the Condar against Method M5G-3 on 3 pellets stoves (18 tests total) and achieved a COV of 3.1%
 |
|
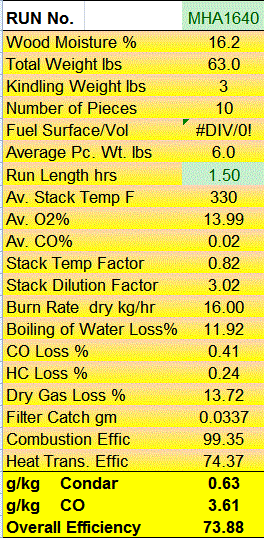
Condar summary
| |
Condar Spreadsheet
Raw Testo Data
Lab Notes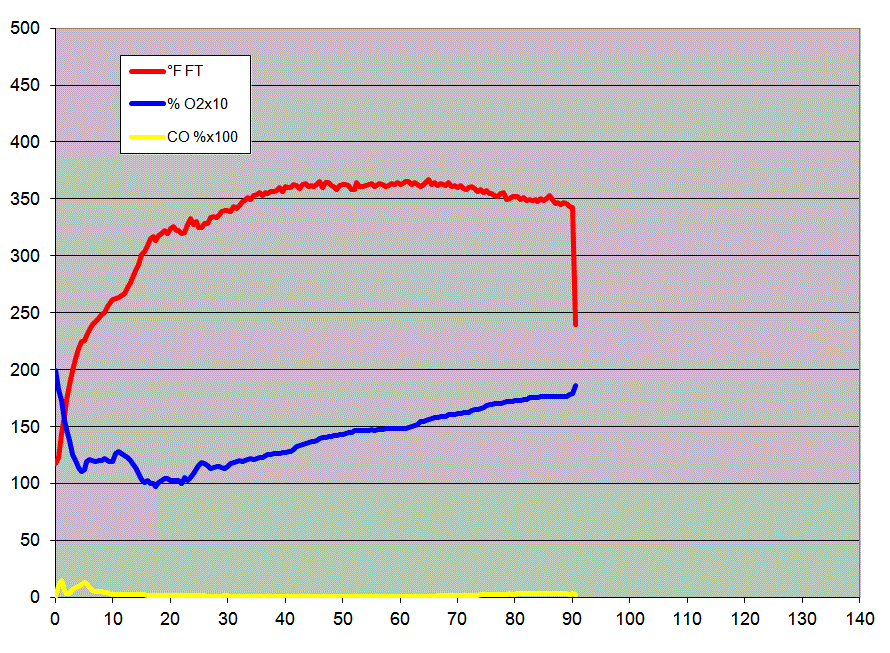
Gas graph. CO low was 68 ppm
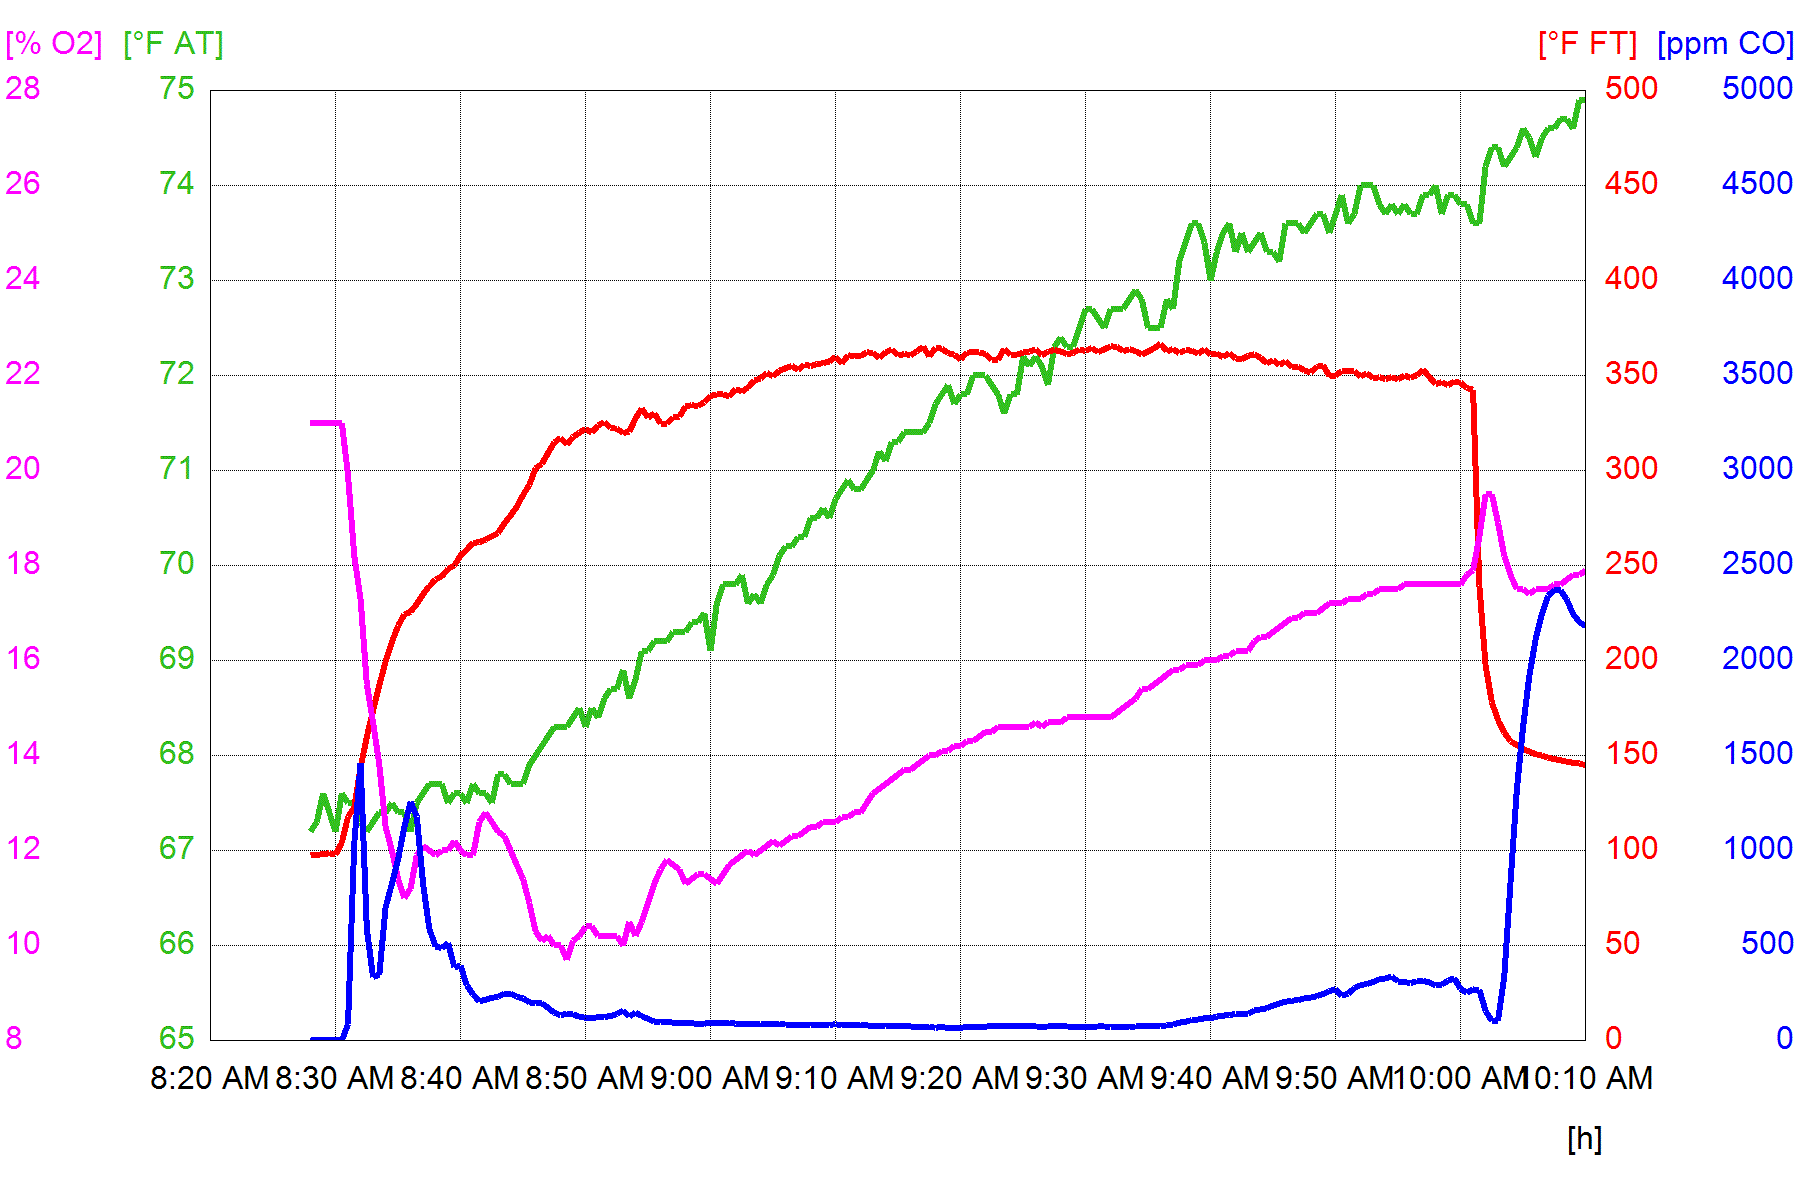
Testo gas graph.
This page was updated on March 31, 2016
This page was created on March 31, 2016


